Identifying manufacturing team leaders with high performance and potential

Identyfing successful team leaders with Talogy manufacturing solutions

The situation


A global automotive manufacturer engaged Talogy to help improve the quality of its manufacturing workforce.  One of the facilities located in Canada has been using Talogy’s manufacturing leadership solution for hiring and promoting employees into Group Leaders.  The process, however, was not utilized formally for the Team Leader position.  This organization decided to revisit the selection process for the Team Leader position.  The goal was to design a standardized and streamlined selection system that would accurately identify the right talents into its front-line leadership roles.

The solution


Talogy’s manufacturing leadership solution is an in-depth online assessment that measures the core competencies for success in leadership roles.  It utilizes multiple measurement methods, such as personal beliefs, situational judgment, and problem-solving scenarios to accurately measure and project an individual’s likelihood for success.  After analyzing the Team Leader jobs, the assessment was considered as one of many options to make a determination for selecting the best qualifying individuals into these jobs.  The organization realized that this tool can be effective not only to select Group Leaders, it can potentially aid in selecting the Team Leader position which is a lower level leadership position.  As such, a concurrent criterion-related validation study was conducted to evaluate the effectiveness of this assessment for Team Leader hiring purposes.

Outcomes


Supervisor performance ratings were collected on a group of Team Leaders currently employed by the organization.  Job performance was rated on several domains, including:

  • Attendance
  • Productivity
  • Quality
  • Safety
  • Working with others
  • Coaching and training
  • Setting a positive example
  • An overall evaluation of the performance.


Overall performance is a combination of all these domains.  In addition to performance ratings, supervisors were asked about the promotability of each individual.  The assessment scores were compared to the key outcomes.

The results indicated that high scoring employees on the assessment were also rated high on job performance by their supervisors and vice versa.  As the graph shows, high scorers received high performance ratings on all key aspects of the job performance as compared to their counterparts.

performance rating in percentile by assessment results graph

Based on the consideration of job analysis findings, meta-analysis of predictive accuracy of the assessment, and empirical data from the current study, a customized footprint was developed to place individuals into four categories (Band A, B, C, and D) based on how well they matched the behavioral success profile.  As the graph shows, individuals who are in Bands A, B, and C are rated higher on overall job performance than individuals who are in Band D.

performance difference in percentile by assessment result graph

In addition, top assessment scorers are much more likely to be considered having potential to be promoted from a Team Leader to a Group Leader.  Supervisors were asked “Do you think this employee has the potential to be a Group Leader?”  Among the top scoring employees, 88% would be considered having potential, in comparison with only 29% of low scoring employees.  Again, this assessment is not only able to identify high performing employees but also high potential employees for the organization.

potential for promotion by assessment graph

Conclusion


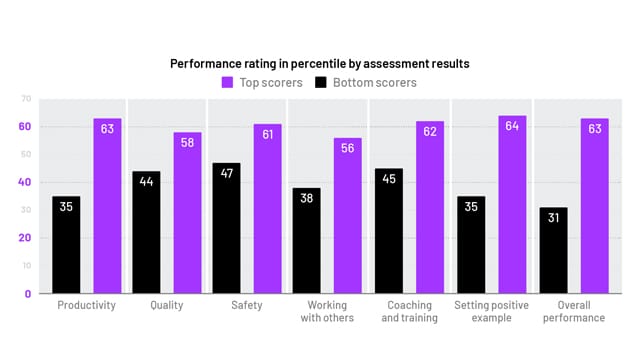
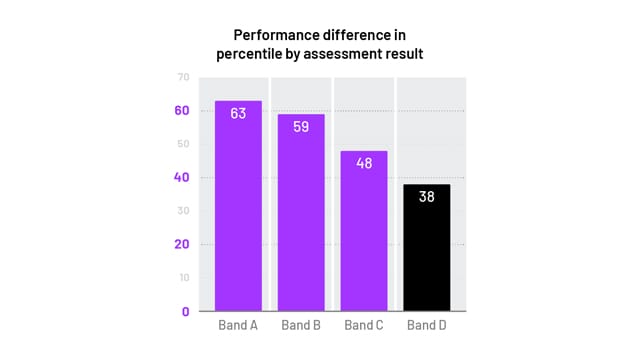
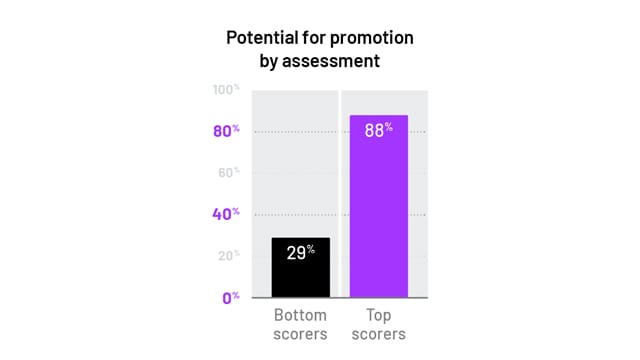
For this organization, using Talogy’s manufacturing leadership solution accurately identifies high performing and high potential individuals in their Team Leader positions.  This assessment will aid this organization in improving the quality of the manufacturing workforce.  To quantify the assessment utility in terms of dollar amounts can be challenging.  One way to estimate return on investment (ROI) is proposed by Cascio (1987), who utilized a formula that approximated a difference of 1 standard deviation in performance ratings associated with a relative dollar value of 40% of the individual’s annual salary.  The 40% value is a conservative estimate for the standard deviation of productivity (Schmidt & Hunter, 1983) and is still one of the conservative ways ROI is calculated (Cascio & Boudreau, 2011).  In this study, there was an improvement of .47 standard deviations from those who would fail versus pass the assessment.  If the Team Leader position pays $50,000 per year, an average improvement of .47 standard deviations is estimated to be worth $9,400 per person per year in increased productivity.  This translates into $940,000 of increased productivity each year if the company hires 100 individuals per year.  There is substantial value of using this assessment in identifying the best first line leaders.

Cascio, W. F. (1987). Applied psychology in personnel management. (3rd ed.), Englewood Cliffs, NJ: Prentice-Hall.

Cascio, W., & Boudreau, J. (2011). Investing in people: Financial impact of human resource initiatives (2nd ed.). Upper Saddle River, NJ: Pearson Education, Inc.

Schmidt, F. L., & Hunter, J. E. (1983). Individual differences in productivity: An empirical test of estimates derived from studies of selection procedure utility. Journal of Applied Psychology, 68(3), 407-414.